What’s Next for ORDI Price After Breakout All-Time High?

[ad_1]
The ORDI price has been this week’s biggest gainer, increasing 185% in the last seven days.
Yesterday, the price created the first daily bearish candlestick after six bullish ones. Is this a sign of things to come, or will a new all-time high follow?
ORDI Continues Rapid Ascent
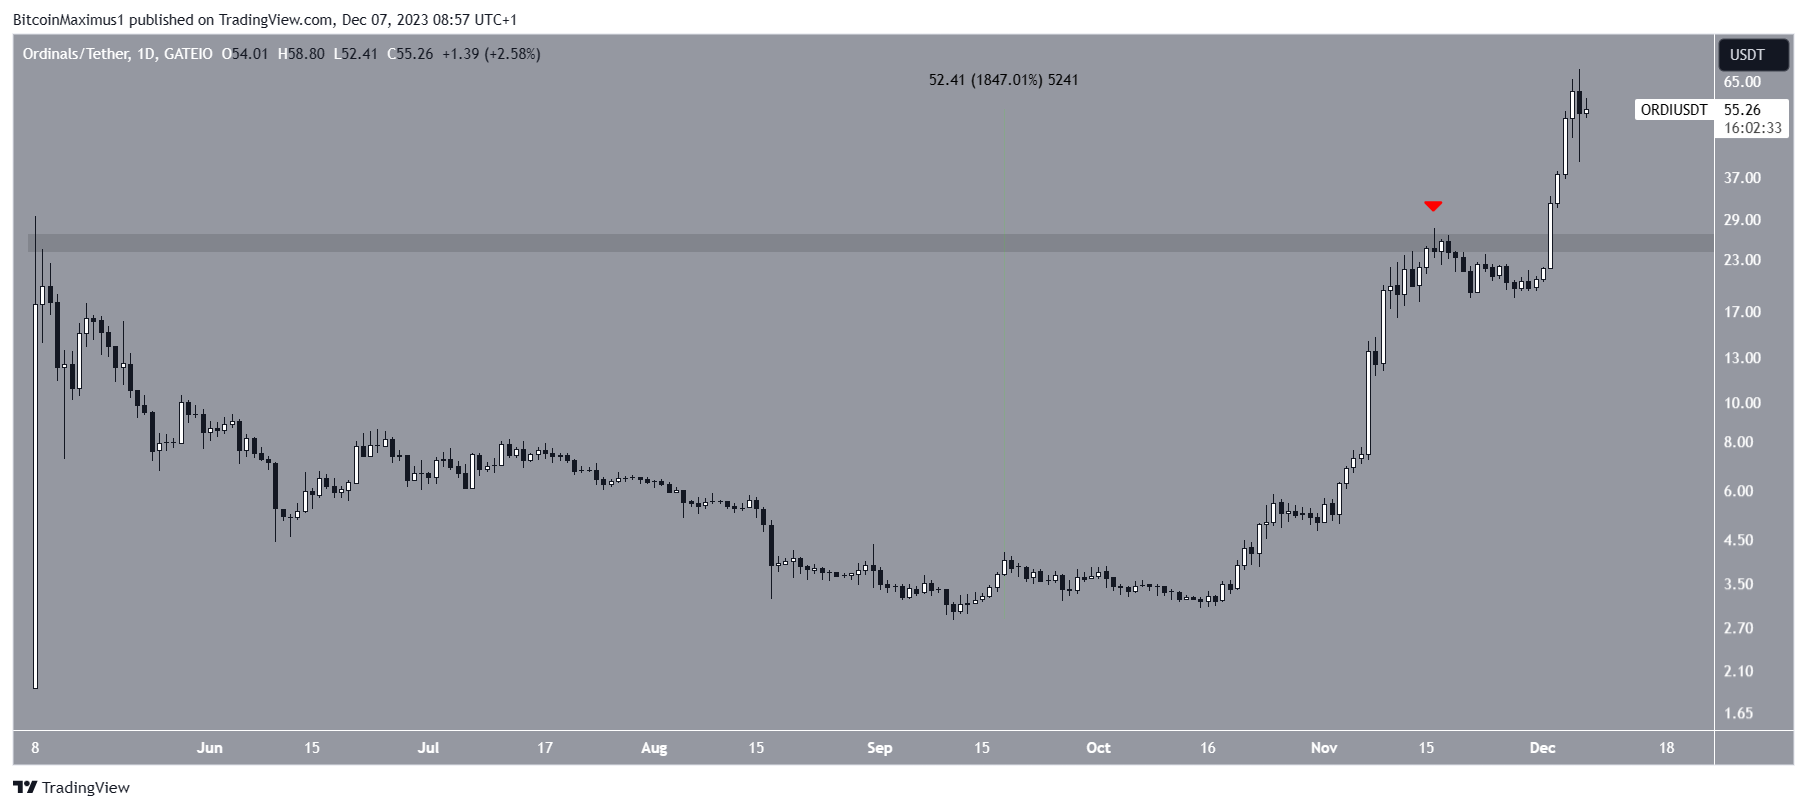
The ORDI price has increased since reaching a local bottom on September 11. The altcoin created a higher low on October 16, and began to swiftly move upwards.
Initially, the ORDI price was rejected by the then-all-time high resistance at $25 (red icon). However, the price broke out on December 2, reaching a new all-time high of $69.72 yesterday.
Since its September low, the ORDI price has increased by 1850%

Cryptocurrency trader The Wolf of Crypto Streets noted that due to the ORDI all-time high, liquidity may relate to BRC-20 tokens.
The BRC-20 token standard is an innovative approach to facilitate the creation and exchange of fungible tokens on the Bitcoin blockchain, utilizing ordinal inscriptions. This experimental standard resembles the ERC-20 token standard commonly found on the Ethereum and EVM blockchain networks.
NiftyNFTNerd is also impressed by the rally, asking his followers if the ORDI price can reach a new all-time high of $100 soon.
Read More: 9 Best Crypto Demo Accounts For Trading
ORDI Price Prediction: Can $100 be Reached?
Technical analysts employ the Elliott Wave theory to identify recurring long-term price patterns and investor psychology, which helps them determine the direction of a trend.
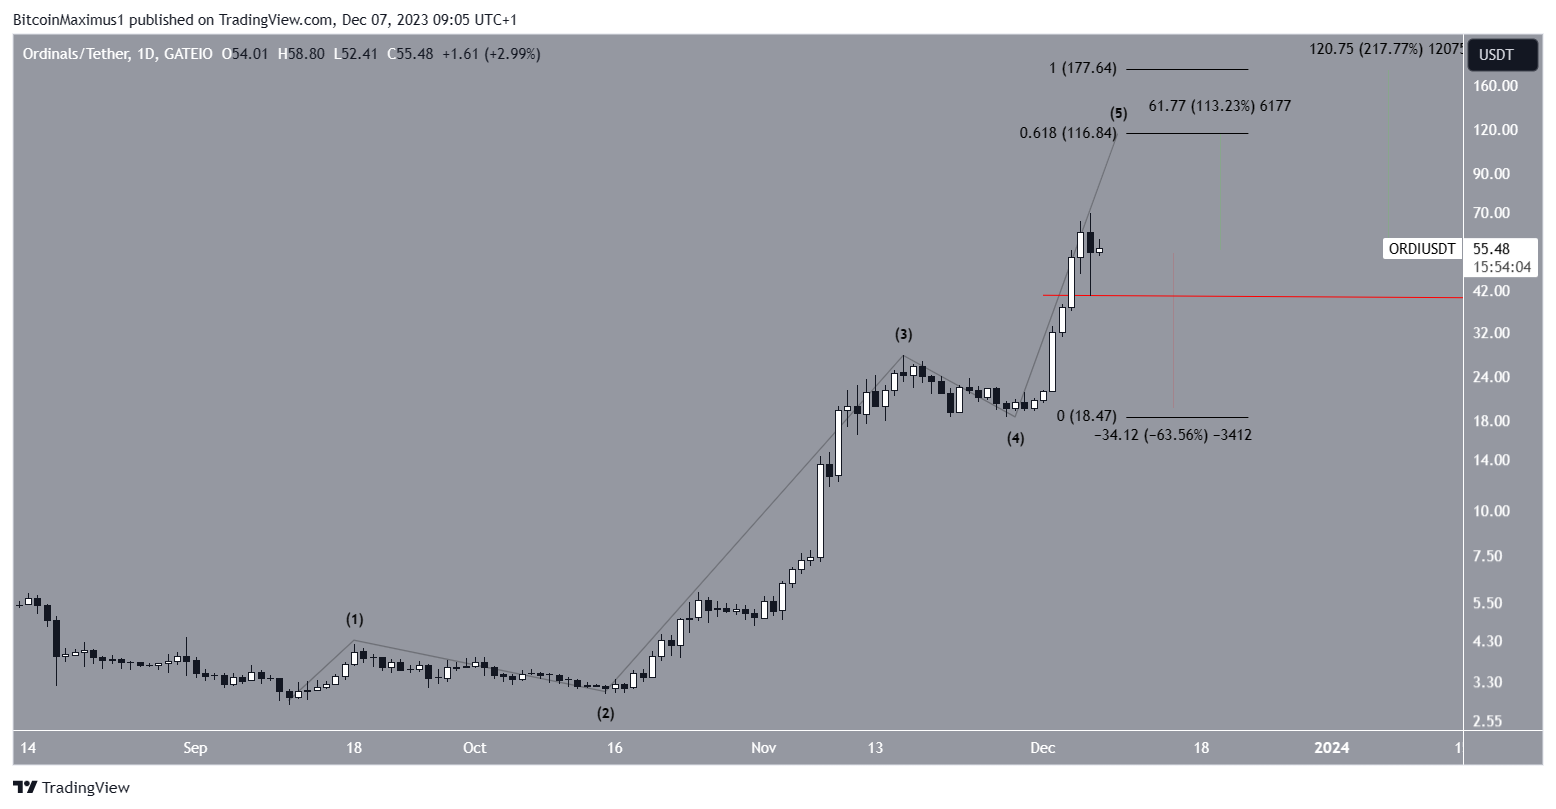
The most likely count suggests that ORDI is in the fifth and final wave of an upward movement that began in September.
Read More: 9 Best AI Crypto Trading Bots to Maximize Your Profits
The most likely area for the top of this wave is at $116, giving wave five 0.618 times the length of waves one and three. If wave five extends, it can reach the $177 resistance, giving wave five the same length as waves one and three.
The first target would amount to an increase of 110%, while the second one to an increase of 220%.

Despite this bullish ORDI price prediction, a decrease below yesterday’s low of $41.80 will mean the price is still correcting. A 60% drop to the closest support at $18.50 will be expected in that case.
For BeInCrypto‘s latest crypto market analysis, click here.
Are there any fees associated with using MultiHODL? | YouHodler Series – YouTube
Disclaimer
In line with the Trust Project guidelines, this price analysis article is for informational purposes only and should not be considered financial or investment advice. BeInCrypto is committed to accurate, unbiased reporting, but market conditions are subject to change without notice. Always conduct your own research and consult with a professional before making any financial decisions.
[ad_2]
Source link


