Bitcoin Nears Historical Halving Market Bottom, RSI Hits New Low

[ad_1]
Bitcoin markets are cyclical and previous ones have moved around halving events. If history is to repeat, the BTC cycle could be nearing its bottom soon.
There are a number of on-chain signals suggesting that Bitcoin is at or near its cycle bottom. The major one is the influence of the halving event as it has been in previous cycles.
The Bitcoin halving is automatically programmed to reduce the block reward by half every four years. The next one is due in May 2024, when the block reward will fall to 3.125 BTC.
Analysts have observed that in previous cycles, Bitcoin tended to bottom 517-547 days prior to the next halving event. According to the halving counter, it is just 495 days away. This means that markets could be very close to their cycle bottom if history rhymes.
Bitcoin RSI at Weakest Levels
Other technical indicators are also flashing cycle bottom signals. The Bitcoin Relative Strength Index (RSI) is the weakest it has ever been, according to the stock-to-flow model creator ‘PlanB.’
The RSI is a momentum indicator measuring the speed and magnitude of the asset’s recent price changes. Furthermore, it is used to evaluate overvalued or undervalued conditions in the markets, which are extremely weak at the moment.
Crypto analyst Miles Deutscher commented that a Bitcoin wick down to $10,000 wouldn’t be that bad since it is tradable:
“It’s actually a prolonged, boring, sideways crab market where alts slowly bleed vs BTC and volume dries up. That’s what real pain looks like.”
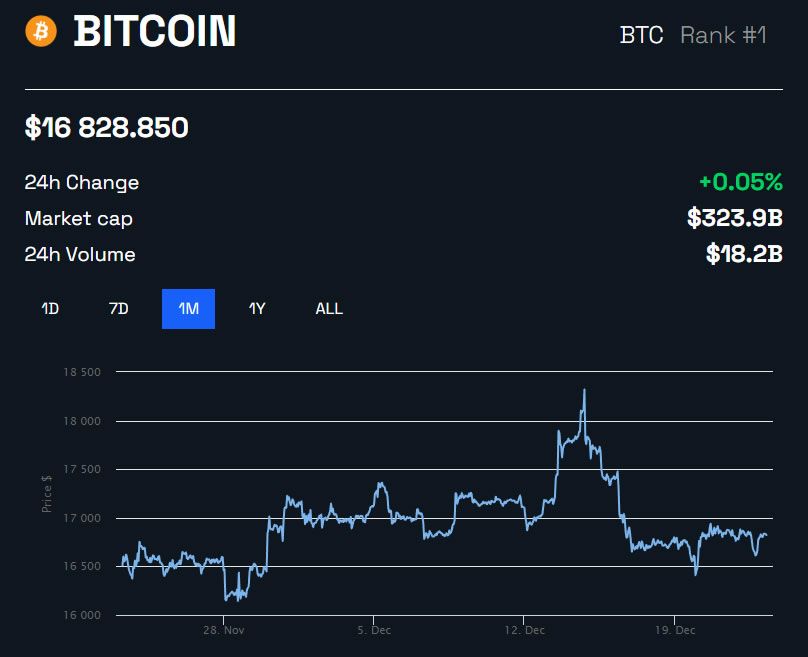
Markets have been sideways since the FTX collapse in early November. Indicators are suggesting that the consolidation is set to continue well into 2023.
On the bright side, there is still a lot of conviction from retail investors and long-term holders. The total supply held by long-term holders is at a record high, according to Glassnode’s lead analyst.
BTC Price Outlook
Bitcoin prices have been flat line since one week ago when it was trading just below $17,000. There has been virtually no movement over the past 24 hours, and the asset was changing hands for $16,829 at the time of press, according to CoinGecko.

BTC prices have not returned to their Nov. 22 cycle low of around $15,700, however, but they’re not far from it. As it stands, Bitcoin is currently down 75.6% from its November 2021 all-time high.
Furthermore, previous bear cycles saw drawdowns of more than 80%, so there could be a bit more pain ahead.
Disclaimer
BeInCrypto strives to provide accurate and up-to-date information, but it will not be responsible for any missing facts or inaccurate information. You comply and understand that you should use any of this information at your own risk. Cryptocurrencies are highly volatile financial assets, so research and make your own financial decisions.
[ad_2]
Source link


